

Track eight core numbers and you will understand almost everything about how your help desk performs: availability, SLA compliance rate, first response time, average resolution time, MTRS/MTTR, MTTD, first contact resolution, and breach rate. Most teams try to enforce too many at once and lose focus. Pick 4 to 6 as your primary, customer-facing SLA commitments, and let the rest run quietly as internal SLOs and SLIs.
TL;DR:
- Focus on prioritizing four to six key SLA metrics, such as availability, response time, and resolution time, instead of tracking too many indicators.
- Using precise formulas that exclude scheduled maintenance and segmenting compliance by priority helps accurately interpret help desk performance.
- Automating timers, alerts, and synthetic checks significantly improves tracking accuracy and allows proactive breach prevention.
- Monitoring the trend of breach counts over multiple weeks is more meaningful than isolated breach numbers, indicating persistent issues.
- Selecting SLA metrics aligned with business criticality and stakeholder input ensures focus on the most impactful system performance indicators.
Table of Contents
- Core SLA metrics explained: what each metric measures and why it matters
- How to choose which SLA metrics to enforce: prioritization framework
- Measurement and formulas for the metrics that matter
- Monitoring and reporting that catch breaches before they happen
- Practical resources for implementing SLA measurement
- Legal and contractual implications of SLA metrics
- Different SLA types and how they change your metrics
- How cloud, on-premises, and hybrid environments change SLA metrics
- The role of automation in measuring and improving SLA metrics
- Common pitfalls in collecting and interpreting SLA metrics
- What effective SLA metrics implementation looks like in practice
- Why focused SLAs beat metric overload
- How Mavericks Office Solutions helps you put these metrics to work
- Sources
- FAQ
Core SLA metrics explained: what each metric measures and why it matters
Each metric answers a different question, and confusing them is one of the fastest ways to misread your help desk’s real performance.
Availability, or uptime, measures the percentage of agreed service time that a system was actually usable. Define your measurement window clearly and exclude scheduled maintenance, or your numbers will punish you for planned work. A system agreed to run 720 hours in a month that experienced 1 hour of unplanned downtime hit roughly 99.86% availability for that window.
SLA compliance rate tells you what share of tickets met their promised timeframe. ITIL benchmarking guidance recommends tracking this as a headline metric and segmenting it by priority level, since a single blended number hides whether your critical incidents or your routine requests are the ones slipping.
First response time and update metrics measure how quickly an agent acknowledges a ticket and keeps the requester informed. These clocks typically activate the moment a ticket is created and pause when the ball is in the customer’s court, a pattern documented in Zendesk’s SLA policy guidance. Response speed shapes perceived responsiveness even before a fix is delivered.
Resolution time comes in several flavors: agent work time, requester wait time, and total elapsed resolution time. Most SLA definitions should use total resolution time for customer commitments, while tracking agent work time internally to separate real effort from queue delays.
MTRS (mean time to restore service) and MTTR (mean time to repair) sound interchangeable but are not. ITIL guidance favors MTRS for customer-facing SLA reporting because it captures the full outage experience, from detection through workaround to full restoration, rather than just the technical repair window.
MTTD (mean time to detect) paired with MTTR reveals how well your monitoring pipeline works. A short MTTR paired with a long MTTD usually means your fix process is fine but your alerting is blind.
First contact resolution (FCR) and escalation rate work as a pair. High FCR with low escalation generally signals a well-trained front line; the inverse often points to knowledge gaps or a ticket routing problem.
SLA breach count and trend matter more together than alone. A single breach might be noise; three consecutive weeks of rising breaches on the same service is a signal worth acting on.
CSAT, customer satisfaction scoring collected after ticket closure, works as a complementary check. A team that hits every SLA target but sees falling CSAT is probably meeting the letter of the agreement while missing the spirit of it.
- Availability excludes scheduled maintenance and uses a clearly defined measurement window.
- SLA compliance rate should be segmented by priority, not reported as one blended figure.
- MTRS is the better metric for customer SLA reporting; MTTR stays useful for internal engineering review.
How to choose which SLA metrics to enforce: prioritization framework
Start by mapping each service to the business outcome it supports, then rank services by how much damage an outage or delay actually causes. A payroll system failure and a printer queue backup are not equally urgent, and your SLA structure should reflect that difference.
- Rank services by business criticality before setting any SLA target.
- Choose 4 to 6 primary, customer-facing SLA commitments that reflect real user experience; track everything else as an internal SLO or SLI.
- Adopt standard metric definitions from frameworks like NIST’s cloud service metric model, which specifies that every metric needs a formal expression, unit, and set of rules so measurements stay reproducible and auditable.
- Set targets by criticality tier and benchmark against industry data where it exists, rather than guessing at a round number.
- Assign clear ownership: who owns each metric, and who signs off when a target changes.
- Write explicit pause and reopen rules so customer wait time and reopened tickets do not silently distort your numbers.
Pro Tip: Write your pause rules into the SLA document itself, not just into the ticketing tool’s configuration, so everyone agrees on what “stopped the clock” actually means.
Measurement and formulas for the metrics that matter
These formulas turn raw ticketing and monitoring data into numbers you can defend in a client meeting or an internal review.
- SLA compliance rate = (Tickets meeting SLA ÷ Total tickets) × 100. For example, if the majority of tickets met their targets this month, compliance would be high. APQC’s benchmarking data reports a median around 90% for the percentage of IT incidents resolved in compliance with SLAs, which gives you a reasonable point of comparison.
- SLA breach rate = (Breached tickets ÷ Total tickets) × 100, reported alongside the raw breach count and its week-over-week trend, not as a standalone percentage.
- Availability = (Total agreed time minus downtime) ÷ Total agreed time × 100. A service agreed to run for 720 hours in a month with 43 minutes of unplanned downtime lands at 99.9% availability, a common benchmark cited in SmartBear’s SLA metrics checklist. Scheduled maintenance windows should be excluded from the downtime figure.
- MTRS = Total restoration time across incidents ÷ Number of incidents, using the full outage window rather than just repair time.
- MTTD = Total detection time ÷ Number of valid incidents, excluding false alarms and duplicate tickets from the sample so the average reflects real detection performance.
- First response and total resolution time follow the same pause logic: the clock stops whenever the ticket is waiting on the customer, a measurement practice detailed in Freshworks’ guidance on ITSM SLA metrics.
Aggregate these figures on consistent daily or weekly windows, and watch for tickets that get reassigned between agents, since misattributed pending-customer time is one of the most common sources of inflated resolution numbers.
Monitoring and reporting that catch breaches before they happen
A dashboard only earns its place if it changes what someone does that day. Build yours around SLA achievement rate, breach trend, MTRS/MTTR, backlog aging, and CSAT, with simple color thresholds (green, yellow, red) rather than dense tables nobody reads under pressure.
- Set pre-breach alerts at 50% and 75% of the SLA clock, with automatic escalation tied to a runbook for priority-one incidents.
- Run daily operational checks for open breaches, weekly trend reviews for pattern spotting, and monthly executive reports translated into business impact language.
- Standardize time zone handling and incident validity rules so a ticket logged at 11:58 PM does not quietly break your weekly numbers.
- Combine ticketing-system timers with monitoring-derived events for MTTD, and add synthetic checks to catch availability gaps that no one filed a ticket for.
A focused SLA program tends to outperform a sprawling one: IBM’s overview of core SLA metrics recommends monitoring a small set built around availability, mean time to recovery, response and resolution time, error rates, and security compliance, rather than tracking dozens of low-value indicators that dilute attention.
Ops teams need the raw, minute-by-minute detail; executives need the same data rolled up into weekly trend lines and dollar-impact language.
Practical resources for implementing SLA measurement
Getting these numbers right depends on collecting clean, reliable telemetry in the first place, which is where most SLA programs quietly fail before they even start.
- Some managed IT service providers run 24/7 monitoring and staff a USA-based help desk with an average response time under 12 minutes, giving readers a working benchmark for what a well-instrumented support operation looks like.
- The 6 Step SMB Playbook for Proactive IT Monitoring walks through building the monitoring foundation that accurate SLA reporting depends on.
- Consistent meter reading and proactive monitoring practices are how a provider collects the clean incident data that SLA metrics require, rather than relying on tickets alone to catch every outage.
Legal and contractual implications of SLA metrics
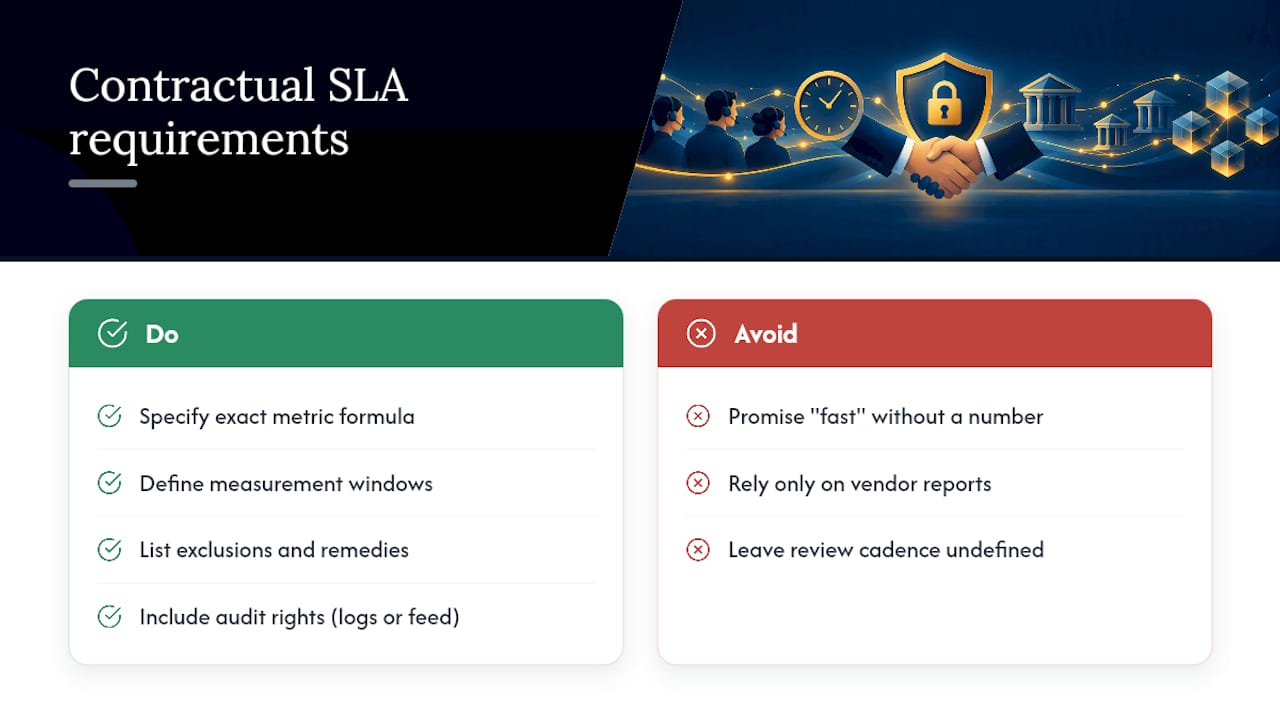
An SLA is a contract, and the metrics inside it carry legal weight the moment they are signed. Vague language, such as promising “fast” support without a defined number, creates disputes later because neither party can prove compliance either way.
Every metric definition in the contract should specify the exact formula, the measurement window, exclusions like scheduled maintenance, and the remedy owed if the target is missed, whether that is a service credit, a fee reduction, or an escalation right. AWS’s explainer on service level agreements shows how cloud providers typically pair an uptime commitment with a defined credit schedule, a structure worth borrowing even for internal SLAs between IT and business units.
Audit rights matter too. If a vendor’s SLA report is the only source of truth, the customer has no way to verify a breach actually happened, or didn’t. Building in a right to request raw logs, or requiring a third-party monitoring feed, closes that gap.
Regulatory context can raise the stakes further. Businesses handling regulated data, financial records, health information, or similar, often need their SLA metrics to align with compliance frameworks, since a missed restoration target on a regulated system can trigger reporting obligations that go well beyond a service credit.
Renewal clauses deserve attention as well. An SLA with no defined review cadence tends to fossilize around outdated targets, leaving one party stuck honoring numbers that no longer match the service’s actual criticality.
Different SLA types and how they change your metrics
A customer-based SLA covers everything one customer receives across multiple services, bundling metrics like response time and resolution time into a single agreement regardless of which underlying system is involved. This works well when a client wants one number to hold you accountable to, but it can hide which specific service is actually underperforming.
A service-based SLA flips that structure, applying one set of metrics to one specific service across all customers who use it. Email uptime, for instance, gets its own target independent of how the ticketing system performs. This makes root-cause tracking easier but multiplies the number of agreements you have to maintain.
A multi-level SLA layers both approaches, typically with a corporate-level agreement, a customer-level agreement, and a service-level agreement stacked on top of each other. Multi-level structures suit larger organizations with varied service portfolios, but they demand more disciplined metric ownership, since a breach at the service level can cascade into a breach at the customer level if nobody is tracking the relationship between the two.
Whichever structure you choose, the underlying metrics stay the same: availability, response time, resolution time, and compliance rate. What changes is the level at which you aggregate and report them.
How cloud, on-premises, and hybrid environments change SLA metrics
Cloud services shift the availability conversation because you inherit your provider’s uptime commitment as a floor under your own. If your cloud vendor guarantees 99.9% and you promise your internal customers 99.95%, you have made a promise you cannot keep, so your own SLA math has to account for that dependency.
On-premises environments put the entire availability and MTRS burden on your own team, since there is no vendor SLA to lean on. That usually means longer MTTD figures unless you invest directly in monitoring tooling, because nobody upstream is watching the infrastructure for you.
Hybrid environments are the hardest to measure cleanly, since an outage can originate in either environment and the ticket often does not make that obvious until someone investigates. Hybrid SLA reporting benefits from tagging incidents by origin (cloud-side or on-premises) from the start, so your MTTD and MTRS figures reflect where the actual delay happened rather than blending two different failure patterns into one misleading average.
The role of automation in measuring and improving SLA metrics
Manual SLA tracking, someone pulling numbers into a spreadsheet at month’s end, tends to be both slow and quietly inaccurate, since pause rules and reopened tickets rarely get applied consistently by hand.
Automated timers built into a ticketing platform apply pause and reopen logic the same way every time, which is the single biggest accuracy improvement most teams can make without buying new tools. Automated alerting, triggered at the 50% and 75% marks of an SLA clock, catches at-risk tickets while there is still time to act, rather than after the breach has already happened.
On the monitoring side, automated synthetic checks and uptime probes generate the detection events that feed MTTD calculations, closing the gap between when an outage actually starts and when a human notices. Automated reporting pipelines that pull from both the ticketing system and the monitoring stack also reduce the double-counting and misattribution errors that show up when someone tries to reconcile two data sources by hand at the end of the month.
Common pitfalls in collecting and interpreting SLA metrics
The most common mistake is tracking too many metrics at once, which spreads attention thin and makes it hard to tell which numbers actually matter this week. A dashboard with 20 widgets gets ignored; one with 5 gets checked daily.
Inconsistent pause rules cause the second most common problem. If one agent stops the clock when a ticket is waiting on the customer and another does not, your compliance rate reflects agent habits more than actual service quality.
Blended averages hide real problems. A resolution time average across all priority levels can look healthy while your priority-one incidents are quietly blowing past target every time, simply because they are outnumbered by low-priority tickets in the same pool.
Reopened tickets create a subtler distortion. Counting a reopened ticket as a fresh, on-time resolution effectively rewards a bad fix, while counting it as a continuation of the original ticket can unfairly penalize an agent who resolved a genuinely new issue.
Time zone and business-hours confusion round out the list. A global help desk that measures response time in one time zone while customers file tickets from several others will produce numbers that look worse (or better) than reality depending on when the ticket happened to land.
What effective SLA metrics implementation looks like in practice
A help desk that reduces its active SLA set from a dozen loosely tracked numbers down to five core commitments, availability, first response time, total resolution time, SLA compliance rate, and MTRS, typically sees faster internal decision making almost immediately, simply because the team stops arguing about which metric matters most.
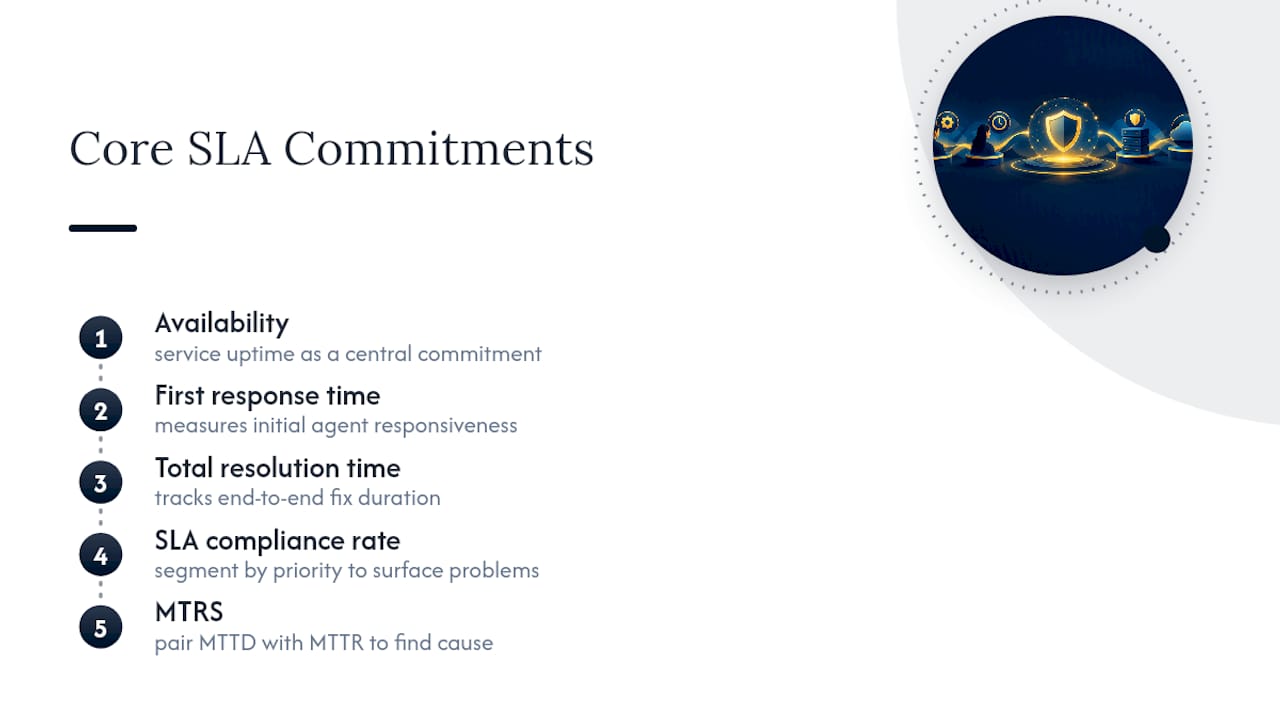
Segmenting SLA compliance by priority level rather than reporting one blended number is one of the more reliable ways to surface a hidden problem. A service that looks fine overall can reveal a struggling priority-one queue the moment the data gets split.
Pairing MTTD with MTTR consistently exposes whether a slow recovery time is a detection problem or a repair problem, which changes where a team should actually invest: better monitoring tooling versus better runbooks and staffing.
Tying CSAT to SLA performance also tends to catch the gap between “technically compliant” and “actually satisfying,” since a team can hit every numeric target and still leave customers frustrated by tone, communication, or a fix that did not fully address the underlying issue.
Why focused SLAs beat metric overload
I keep coming back to the same conclusion: the SLA programs that hold up under pressure are the narrow ones. Four to six metrics, reviewed with business owners on a set cadence, tied directly to revenue impact and uptime for the systems that actually matter, will outperform a wall of dashboards nobody checks. Track fewer things, but track them honestly.
— Jeffrey
How Mavericks Office Solutions helps you put these metrics to work
Building the dashboards, pause rules, and alerting described above takes real setup time, which is exactly the work Mavericks Office Solutions’ Managed IT Services handle for small and medium businesses that would rather not build it themselves.

Our 24/7 monitoring and USA-based help desk apply the same measurement discipline covered in this guide, and our proactive IT monitoring approach is built to catch problems before they turn into breaches. If you want an SLA assessment or a plan for implementing this kind of monitoring, reach out and we will walk through what your current setup is missing.
Sources
- NIST Special Publication 500-307, Cloud Service Metrics model
- Percentage of IT incidents resolved in compliance with SLAs | APQC
- ITIL Performance Benchmarking Model (ITIL PBM)
- What are SLA metrics? Monitoring SLA performance in ITSM (Freshworks)
FAQ
What are common SLA metrics?
The most commonly tracked SLA metrics are availability or uptime, SLA compliance rate, first response time, average resolution time, MTRS/MTTR, MTTD, first contact resolution, and breach rate. IBM recommends focusing on a small core group, such as availability, recovery time, and response and resolution time, rather than tracking every possible indicator.
What is SLA in the IT industry?
An SLA, or service level agreement, is a contract that defines the specific performance targets an IT provider or internal team commits to, along with how those targets are measured and what happens if they are missed. It typically covers metrics like response time, resolution time, and availability, with formal definitions specified in frameworks such as NIST’s cloud service metric model.
What is SLA P1, P2, P3, P4?
P1 through P4 are priority tiers used to assign different SLA targets based on how severe an issue is, with P1 (or priority one) reserved for critical outages that need the fastest response and resolution times. Definitions vary by organization, but a common pattern is P1 for full outages, P2 for major degraded service, P3 for minor issues, and P4 for low-impact requests.
What is an SLA vs KPI?
An SLA is a contractual commitment with a specific target and often a remedy attached if it is missed, while a KPI (key performance indicator) is simply a metric an organization tracks to gauge performance, with no contractual obligation attached. A metric can function as both: SLA compliance rate is a KPI that also happens to be a contractual promise once it is written into an SLA.
What is a good help desk SLA response time?
A commonly cited target for help desk first response is under 12 minutes for priority-one issues, though acceptable targets vary by service criticality and industry. Zendesk’s SLA policy guidance recommends setting response time targets by priority tier rather than applying one blanket number across all ticket types.