
Proactive IT monitoring continuously watches critical systems for early indicators so you can fix issues before users notice. It replaces the old break-fix cycle with baselines, anomaly detection, and automation that catch a failing drive or a maxed-out server days before it takes down your business. The payoff is fewer emergencies, less unplanned downtime, and much less time spent firefighting.
TL;DR:
- Starting with critical systems such as servers, network devices, and key applications ensures monitoring efforts focus on assets that would cause the most business disruption.
- Establishing behavioral baselines for two to four weeks and continuously updating them prevents false alarms caused by static thresholds.
- Use anomaly detection and dynamic thresholds to identify genuine issues without triggering unnecessary alerts during predictable workload spikes.
- Automate routine fixes like restarting services or clearing logs to reduce manual workload, but escalate complex problems immediately to human operators.
- Implement regular review cycles for alert thresholds and monitor patch deployment, verification, and compliance to maintain an effective proactive monitoring strategy.
Table of Contents
- What Is Proactive IT Monitoring, Really?
- Which Metrics and Systems Should You Monitor First?
- How Do You Build a Proactive Monitoring Strategy That Actually Works?
- What Tools and Integrations Support Proactive Monitoring?
- Why Does Patch Management Belong Inside Your Monitoring Program?
- How Should an SMB Roll Out Proactive Monitoring in Phases?
- Why Proactive Monitoring Changes the Math for Small Businesses
- A Practical Next Step for Getting Proactive Monitoring Running
- Where to Learn More About Proactive Monitoring Standards
- Sources
What Is Proactive IT Monitoring, Really?
Proactive monitoring continuously compares current performance against a known baseline and flags anomalies before they become outages. That’s the core distinction from reactive support: reactive IT waits for a server to crash or a user to submit a ticket, then scrambles to diagnose the damage. Proactive monitoring watches the trend line instead of waiting for the cliff.
You’ll see the difference in the early warning signs it catches:
- A CPU trending upward over three weeks instead of spiking suddenly on a Monday morning
- S.M.A.R.T. warnings on a hard drive showing early sector errors, long before the drive fails outright
- Latency drift on a network link that’s degrading five milliseconds a week, invisible to users until it isn’t
Automated remediation handles the routine stuff, restarting a stalled service, clearing a full temp directory, rotating a log file. Anything touching a Tier 1 system, a security event, or an unfamiliar failure pattern needs to escalate to a human immediately. The goal isn’t to remove people from the loop; it’s to make sure they’re solving the interesting problems instead of the repetitive ones.
Which Metrics and Systems Should You Monitor First?
Not every server, switch, or app deserves the same attention. Start with the assets that would actually hurt if they went down, then build outward.
Core monitoring targets typically include:
- Physical and virtual servers (CPU, memory, disk I/O)
- Network devices: routers, switches, firewalls, and wireless access points
- Line-of-business applications and databases
- Endpoints (laptops, desktops, mobile devices)
- Backup jobs and their completion status
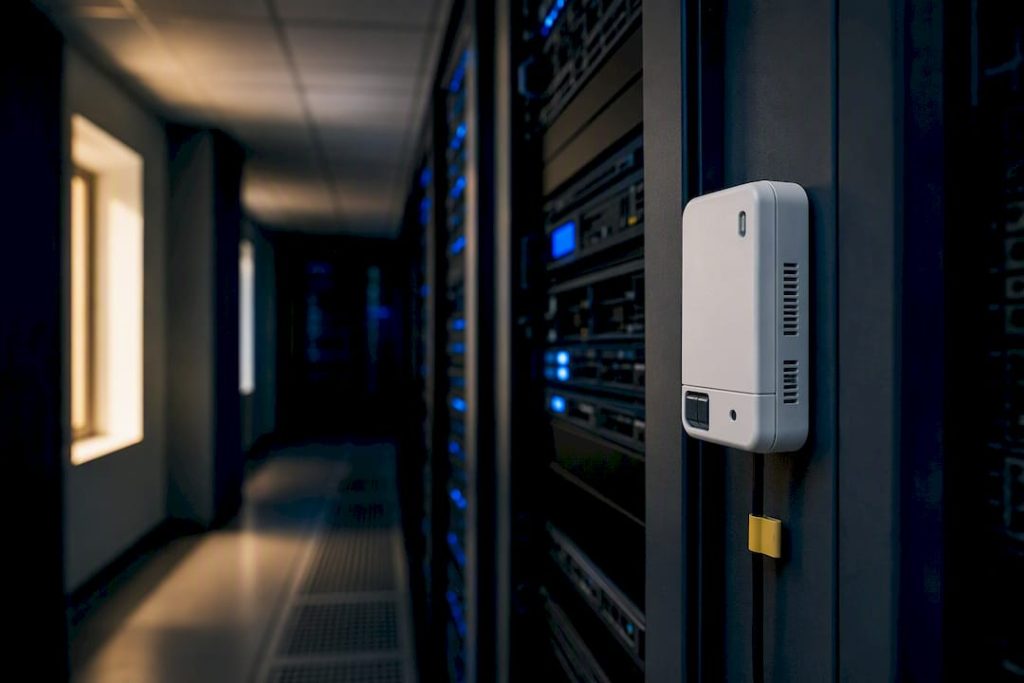
- Environmental sensors: temperature, humidity, and UPS battery health
The KPIs that matter most are CPU and memory utilization, disk I/O, response time, packet loss, error rates, backup success rates, SSL certificate expiry dates, and S.M.A.R.T. disk health scores. Skip the temptation to track everything just because your tool allows it. Effective programs focus on the right KPIs for the specific environment rather than drowning the team in raw telemetry.
Statistic Callout: Environmental and synthetic checks often catch the causes nobody thinks to look for. A failing air conditioning unit or a degrading disk drive can take down a server room hours before any application-layer alert fires, which is exactly why temperature and UPS monitoring belong on the same dashboard as CPU graphs.
Dependency mapping ties this together. If you don’t know that your accounting app depends on a specific database server, which depends on a specific switch, a single alert tells you almost nothing about root cause. Topology-aware monitoring lets you trace an outage back to its source in minutes instead of hours, which matters enormously when a client is waiting on an invoice.
How Do You Build a Proactive Monitoring Strategy That Actually Works?
Most monitoring programs fail for one of two reasons: static thresholds that generate noise, or alerts that never reach the right person. Fixing both starts with baselines.
- Establish baselines before you set alert thresholds. Watch each system for two to four weeks under normal load before deciding what “abnormal” looks like. Static thresholds are often counterproductive because a server that normally runs at 70% CPU during month-end close will trigger constant false alarms if your threshold is set at 65%.
- Use dynamic thresholds and anomaly detection. Rules that adjust for time of day, day of week, and seasonal business cycles catch real problems without punishing you for predictable spikes.
- Design alerting by severity, not by volume. A disk at 90% capacity is not the same urgency as a payment gateway timing out. Route each severity tier to a different channel, an inbox for low-priority warnings, a phone call for anything customer-facing.
- Automate the repeatable fixes. Clearing cache, restarting a hung service, rotating logs, these belong in a runbook triggered automatically, not in a technician’s manual queue.
- Prioritize by business risk. Classify assets into tiers, Tier 1 for anything that stops revenue or operations if it fails, Tier 2 for everything else, and weight your monitoring cadence accordingly.
- Set measurement cadences. Daily checks for backup jobs and security logs, weekly reviews of capacity trends, monthly patch compliance audits, and quarterly reviews of the entire monitoring strategy itself.
Pro Tip: Review your alert thresholds every quarter, not just when you first set them. A threshold that made sense with 20 employees usually breaks down at 50, and nobody remembers to revisit it until the false alarms start piling up.
What Tools and Integrations Support Proactive Monitoring?
The right monitoring stack does more than collect numbers. It maps your network, tests transactions the way a real user would, and talks to the rest of your IT ecosystem.
Look for these capabilities when evaluating a platform:
- Automated discovery and network mapping to build (and maintain) an accurate topology
- Synthetic monitoring that simulates a login, a checkout, or an email send to catch problems before a real customer does
- Anomaly detection built on historical baselines rather than fixed thresholds
- Open APIs and webhooks for connecting alerts to other systems
- Integration with ticketing platforms so an alert automatically becomes a tracked, assigned task
Platforms combining discovery, mapping, and automation integrations shorten both detection and repair time, because the alert already carries context about what depends on the failing component. Integration with your endpoint detection and response tooling matters too, since a monitoring platform that only watches performance metrics misses security-driven anomalies entirely.
If you’re just getting started, don’t try to instrument everything at once. Turn on discovery first, map what you actually have, then layer in synthetic transaction monitoring for your two or three most business-critical workflows before expanding further.
Why Does Patch Management Belong Inside Your Monitoring Program?
Patching isn’t a separate IT chore, it’s preventive maintenance, and it belongs on the same dashboard as your performance metrics. NIST’s guidance on enterprise patch management frames it exactly that way, recommending automation to deploy patches and monitor their outcomes rather than treating patching as an occasional manual sweep.
Verification matters as much as deployment. After a patch rolls out, you need to confirm it actually installed, check for behavior changes it might have introduced, and watch for the rare case where a rollback is necessary. That’s monitoring work, not just IT hygiene.
A workable patch cadence includes:
- Weekly reviews of available patches, prioritized by severity
- Automated deployment to non-critical systems first, with staged rollout to Tier 1 assets
- Compliance checks confirming which systems are current and which have drifted
- Post-patch monitoring for unexpected CPU spikes, crashes, or service failures
Skipping this cadence is how businesses end up doing emergency patching at 11 p.m. after a ransomware vector goes public. Automation, again, is what makes this sustainable, since manually tracking patch status across even 30 machines becomes unmanageable fast.
How Should an SMB Roll Out Proactive Monitoring in Phases?
Trying to monitor everything on day one is how teams end up ignoring every alert within a month. A phased rollout works better, and it maps cleanly to how most SMBs actually operate.
- Phase 1, discovery and Tier 1 mapping. Inventory your systems, classify them by business risk, and turn on synthetic checks for your most critical service first. Starting with one critical service and learning the tool before expanding keeps the rollout from turning into data overload that nobody has time to review.
- Phase 2, baseline and automation. Spend two to four weeks collecting baseline data, tune your alert thresholds against that data, then automate the two or three most repetitive fixes your team handles manually today.
- Phase 3, extend coverage and assign ownership. Add backup verification, patch compliance tracking, and security event monitoring. Define who owns each alert category and what response time is acceptable for each one, since businesses that have outgrown break-fix support usually stall right here without clear ownership.
Pro Tip: Measure success by what stops happening, not what starts happening. Fewer after-hours emergency calls and fewer “why is this so slow” tickets are better proof the program works than a longer list of monitored metrics.
Acceptance criteria worth tracking include: percentage of Tier 1 systems with active synthetic checks, mean time to detect an anomaly, and the ratio of automated fixes to human-escalated tickets.
Why Proactive Monitoring Changes the Math for Small Businesses
The honest case for proactive monitoring isn’t that it eliminates downtime, nothing does that. It’s that it shifts your team’s time from reacting to predicting, and that shift compounds. A business running mostly reactive support spends its best technical hours on the same three fires every month. A business running proactive monitoring spends those hours tuning thresholds and reviewing trends, which is a far better use of scarce IT talent at an SMB.
Where this gets debated is the build versus buy question. Building an in-house proactive monitoring program takes real investment, someone has to own the tuning, the escalation policy, and the 2 a.m. pager duty. For many SMBs, a managed model with 24/7 monitoring and a fast, USA-based help desk response is simply the more realistic path to the same outcome.
— Jeffrey
A Practical Next Step for Getting Proactive Monitoring Running
Building all of this in-house, baselines, dynamic thresholds, patch verification, and a 24/7 alert pipeline, takes real engineering time most SMBs don’t have to spare. A managed IT services provider can run this exact playbook as a standing service: continuous monitoring across your servers, network, and endpoints, backed by a USA-based help desk that averages under 12 minutes to respond, not a call center reading from a script three time zones away.

That means your Tier 1 systems get watched around the clock, patches get deployed and verified on a set cadence, and the alerts that matter reach a real technician instead of piling up in an inbox nobody checks on Fridays. If you’re still running break-fix support and absorbing the downtime that comes with it, the fastest way to see what a monitored environment looks like is to talk to someone who already runs one. Get a managed IT services assessment scheduled and find out where your infrastructure’s blind spots actually are.
Where to Learn More About Proactive Monitoring Standards
For deeper technical grounding, NIST’s patch management guidance covers preventive maintenance frameworks in detail. The Paessler blog on proactive monitoring breaks down baseline-driven alerting, and F1Group’s preventive maintenance guide offers concrete maintenance cadence examples worth adapting to your own environment.
Sources
- Proactive monitoring: Preventing IT problems before they impact your business — Paessler blog
- Guide to Enterprise Patch Management Planning: Preventive Maintenance for Technology — NIST SP 800-40r4
- Preventive Maintenance: IT Guide for 2026 — F1Group